Last fall, the Economic Cycle Research Institute loudly and unequivocally said the US was headed into a recession. It wasn't. Now ECRI's leading indicators have recovered and turned positive, though the last two weeks have seen a slight dip...
ECRI Weekly Leading Indicator: The Growth Index Slips Again
The Weekly Leading Index (WLI) growth indicator of the Economic Cycle Research Institute (ECRI) is now at 0.6 as reported in today's public release of the data through April 20. This is the second consecutive week-over-week decline since January 6th. However, the underlying WLI rose fractionally from an adjusted 123.8 to 124.1 (see the fourth chart below).
The History of ECRI's Recession Call
ECRI's weekly leading index has become a major focus and source of controversy ever since September 30th of last year, when ECRI publicly announced that the U.S. is tipping into a recession, a call the Institute had announced to its private clients on September 21st. Here is an excerpt from the announcement:
Early last week, ECRI notified clients that the U.S. economy is indeed tipping into a new recession. And there's nothing that policy makers can do to head it off.
ECRI's recession call isn't based on just one or two leading indexes, but on dozens of specialized leading indexes, including the U.S. Long Leading Index, which was the first to turn down — before the Arab Spring and Japanese earthquake — to be followed by downturns in the Weekly Leading Index and other shorter-leading indexes. In fact, the most reliable forward-looking indicators are now collectively behaving as they did on the cusp of full-blown recessions, not "soft landings." (Read the report here.) |
The Certainty and Dramatic Language of ECRI's Recession Call
What was particularly striking about ECRI's current recession call is the fervor and certainty of the language in the public press release:
| Here's what ECRI's recession call really says: if you think this is a bad economy, you haven't seen anything yet. And that has profound implications for both Main Street and Wall Street. |
Note the complete absence of wiggle room in the announcement, nor have there been any public communications from ECRI to qualify or soften its recession call. ECRI has put its credibility on the line.
Seven months have now passed since the ECRI recession call, which — coincidentally — occurred on the same day that the Federal Reserve announced Operation Twist (see this update on the effectiveness the Fed's strategy). Has Fed policy been a factor in delaying or eliminating the recession ECRI saw in its crystal ball?
Mainstream Economists on the Recession Risk
Earlier this week I featured a commentary on the April Wall Street Journal survey of economists. I singled out their opinions on GDP, but I also included the results of the WSJ survey questionnaire about the probability, on a scale of 1 to 100, of a US recession in the next 12 months. None of the economists in January offered a negative GDP forecast; however, the average response to the recession probability question was 16%, a small drop from January's 19%.
The ECRI recession call has, at this point, been of little value for financial planning. In fact, if the public announcement of their recession call sent investors to the sidelines, they missed a gain of over 22% in the S&P 500 as of yesterday's close.
The "Yo-Yo Years"
Last month ECRI posted a public commentary (March 22) with the intriguing title The Yo-Yo Years. The commentary is a version of Lakshman Achuthan's presentation at the Bloomberg Sovereign Debt Conference in Frankfurt, Germany, and is a must-read for anyone following the ECRI data.
Essentially Achuthan argues that we are entering an era of more frequent recessions as a result of two things: 1) declining economic trend growth and 2) increased cyclical volatility following the end of the Great Moderation (circa mid-1980s to 2007). The "we" in the sentence above is not only the US but also much of the developed world, especially Europe. Moreover, the idea of global "decoupling" is largely a myth because of the export dependence of most economies.
Particularly interesting is Achuthan's discussion of the Bullwhip Effect, "where small fluctuations in consumer demand growth get amplified up the supply chain into big swings in demand as we move away from the consumer." Achuthan goes on to explain the mechanics of amplification of the Bullwhip effect on more frequent recessions in developed countries to the countries that supply intermediate and crude goods.
Year-over-Year Growth in the WLI
Triggered by another ECRI commentary, Why Our Recession Call Stands, I'm now focusing initially on the year-over-year growth of the WLI rather than ECRI's previously favored, and rather arcane, method of calculating the WLI growth series from the underlying WLI (see the endnote below). Specifically the chart immediately below is the year-over-year change in the 4-week moving average of the WLI. The red dots highlight the YoY value for the month when recessions began.
As the chart above makes clear, the WLI YoY is currently at a lower level than at the starting month for five of the seven recessions during the published series. Of course, the same can be said for its interim YoY trough in 2010. In any case, the behavior of this indicator over the next quarter or so will be especially interesting to watch.
The WLI Growth Metric
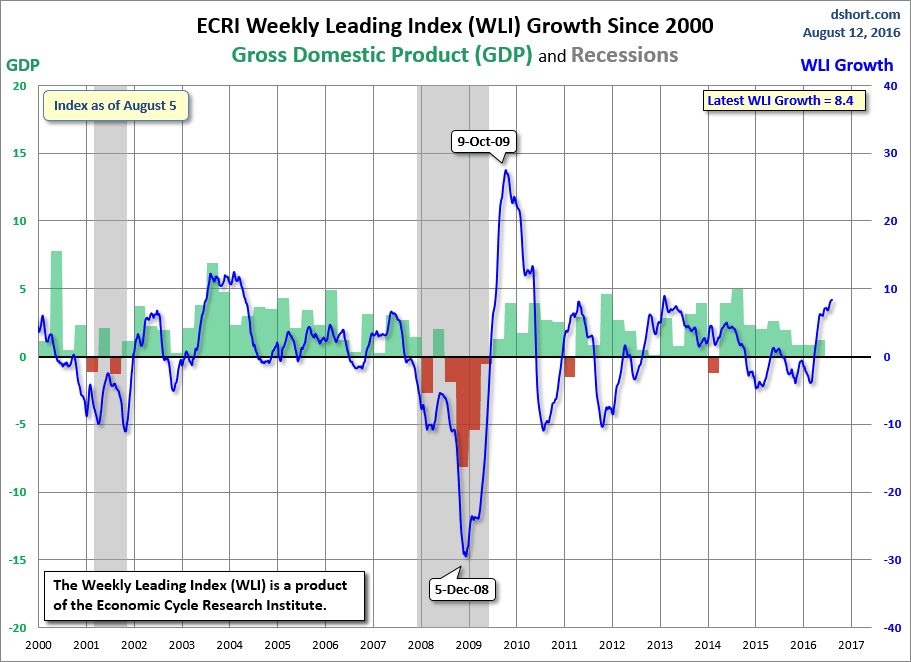
The best known of ECRI's indexes is their growth calculation on the WLI; it's that arcane calculation referenced above. For a close look at this index in recent months, here's a snapshot of the data since 2000.
Now let's step back and examine the complete series available to the public, which dates from 1967. ECRI's WLI growth metric has had a respectable record for forecasting recessions and rebounds therefrom. The next chart shows the correlation between the WLI, GDP and recessions.
A significant decline in the WLI has been a leading indicator for six of the seven recessions since the 1960s. It lagged one recession (1981-1982) by nine weeks. The WLI did turned negative 17 times when no recession followed, but 14 of those declines were only slightly negative (-0.1 to -2.4) and most of them reversed after relatively brief periods.
Three other three negatives were deeper declines. The Crash of 1987 took the Index negative for 34 weeks with a trough of -6.8. The Financial Crisis of 1998, which included the collapse of Long Term Capital Management, took the Index negative for 23 weeks with a trough of -4.5.
The third significant negative came near the bottom of the bear market of 2000-2002, about nine months after the brief recession of 2001. At the time, the WLI seemed to be signaling a double-dip recession, but the economy and market accelerated in tandem in the spring of 2003, and a recession was avoided.
The question had been whether the WLI decline that began in Q4 of 2009 was a leading indicator of a recession. The published index has never dropped to the -11.0 level in July 2010 without the onset of a recession. The deepest decline without a recession onset was in the Crash of 1987, when the index slipped to -6.8. ECRI's managing director correctly predicted that we would avoid a double dip. The positive GDP since the end of the last recession supports ECRI's stance.
A Look at the Underlying index
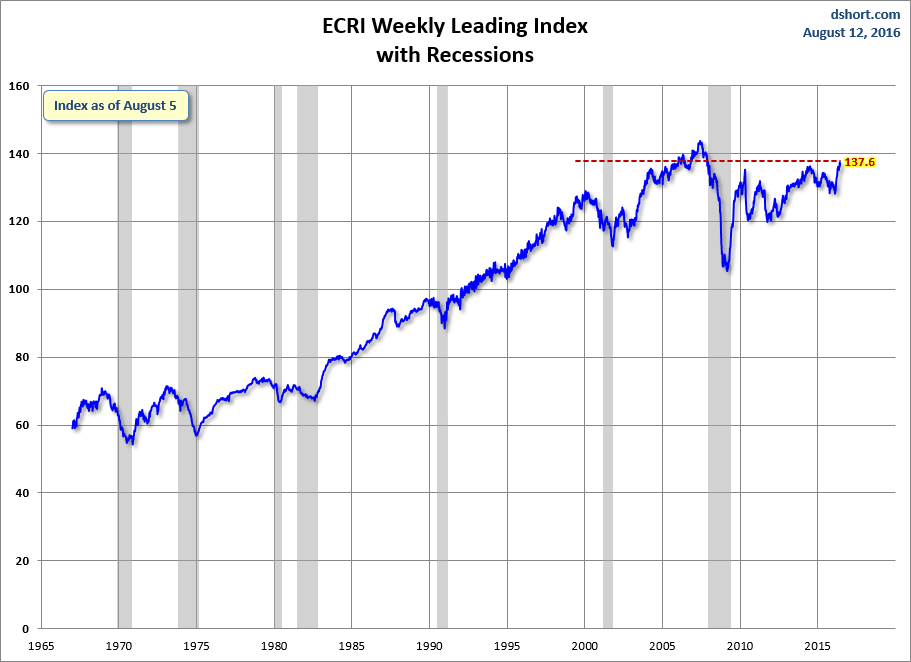
With the Growth Index's general resilience in 2012, let's take a moment to look at the underlying Weekly Leading Index from which the Growth Index is calculated. The first chart below shows the index level.
For a better understanding of the relationship of the WLI level to recessions, the next chart shows the data series in terms of the percent of the previous peak. In other words, a new weekly high registers at 100%, with subsequent declines plotted accordingly.
As the chart above illustrates, only once has a recession occurred without the index level achieving a new high -- the two recessions, commonly referred to as a "double-dip," in the early 1980s. Our current level is 12.6% off the most recent high, which was set 4.8 years ago. The longest stretch between highs was about 5.2 years from February 1973 to April 1978. But the index level rose steadily from the trough at the end of the 1973-1975 recession to reach its new high in 1978. The pattern we're now witnessing is quite different.
Additional Analysis on Recession Forecasting
Here are some links to some useful articles for evaluating the substance of the ECRI's controversial recession call:
Earlier discussions of the ECRI recession call include these commentaries:
Here is Dwaine's snapshot of the WLI, which should be studied in the context of his expanded analysis at his RecessionAlert website:
Another Source for Recession Forecasts
For a carefully researched and frequently updated alternative perspective on recession risk, see the Recession Alert website maintained by Sharenet and PowerStocks Research.
Note: How to Calculate the Growth series from the Weekly Leading Index
ECRI's weekly Excel spreadsheet includes the WLI and the Growth series, but the latter is a series of values without the underlying calculations. After a collaborative effort by Franz Lischka, Georg Vrba, Dwaine van Vuuren and Kishor Bhatia to model the calculation, Georg discovered the actual formula in a 1999 article published by Anirvan Banerji, the Chief Research Officer at ECRI: The three Ps: simple tools for monitoring economic cycles - pronounced, pervasive and persistent economic indicators.
Here is the formula:
"MA1" = 4 week moving average of the WLI
"MA2" = moving average of MA1 over the preceding 52 weeks
"n"= 52/26.5
"m"= 100
WLIg = [m*(MA1/MA2)^n] – m
Please follow Money Game on Twitter and Facebook.
Join the conversation about this story »


Source: http://feedproxy.google.com/~r/TheMoneyGame/~3/UzCEtijzZTU/meanwhile-the-leading-ecri-index-has-gone-positive-so-much-for-that-recession-call-2012-4
Personal Finance News & Advice Guide To Financial Fitness Money Game Tech Crunch


